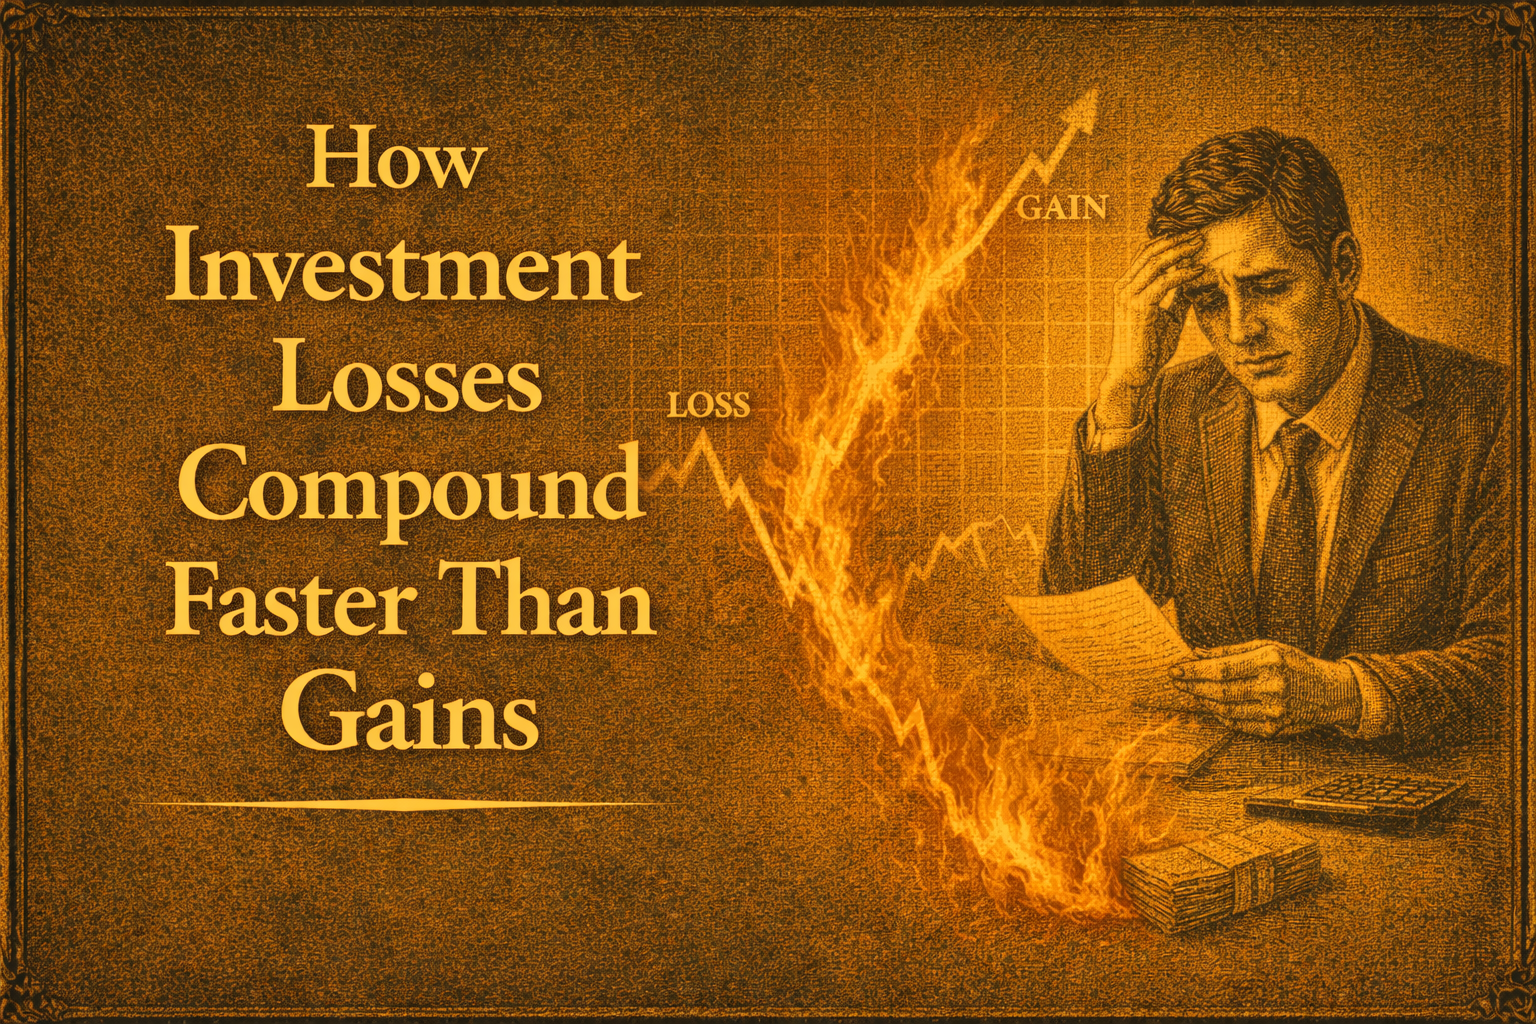
How Investment Losses Compound Faster Than Gains
How Investment Losses Compound Faster Than Gains: The Asymmetric Mathematics of Drawdowns
A 50% loss requires a 100% gain to break even.
Not approximately.
Not emotionally.
Not theoretically.
Exactly.
This is arithmetic.
And most investors never fully absorb what it means for:
- Position sizing
- Portfolio risk
- Recovery timelines
- Long-term compounding
This guide explains:
- Why losses and gains are mathematically asymmetric
- How recovery requirements accelerate nonlinearly
- Why drawdowns consume compounding time
- How sequence risk changes outcomes
- Where standard investing advice becomes incomplete
- What this framework changes about risk management
The core insight is simple:
The true cost of a loss is not the loss itself. It is the years of compounding consumed by recovery.
What Drawdown Asymmetry Actually Means
Drawdown asymmetry refers to the mathematical fact that percentage losses and percentage gains do not operate symmetrically.
Losses reduce the capital base.
Recovery must occur from that smaller base.
This creates accelerating recovery requirements.
Examples:
- 10% loss → 11.1% gain required
- 20% loss → 25% gain required
- 50% loss → 100% gain required
- 75% loss → 300% gain required
- 90% loss → 900% gain required
The relationship is not linear.
Each additional percentage point of loss increases the required recovery disproportionately.
This happens because the denominator changes.
Example:
- $100,000 portfolio loses 50%
- Remaining capital = $50,000
- Recovering to $100,000 requires doubling $50,000
That requires:
A 100% gain
The percentages look symmetrical.
The mathematics are not.
The Core Recovery Formula
The relationship between losses and required recovery follows a fixed formula:
Required Recovery Gain = Loss ÷ (1 − Loss)
Where:
- Loss is expressed in decimal form
Examples:
| Loss | Required Recovery Gain |
|---|---|
| 10% | 11.1% |
| 20% | 25% |
| 25% | 33.3% |
| 50% | 100% |
| 60% | 150% |
| 75% | 300% |
| 90% | 900% |
The key pattern:
The deeper the drawdown, the exponentially harder the recovery.
This is not market opinion.
It is embedded in percentage mathematics itself.
Why Time Makes the Problem Worse
The asymmetry is not only about percentage recovery.
It is also about time.
Assume:
- Long-term portfolio return expectation = 8% annually
A 50% drawdown requires a 100% recovery.
At 8% compounded annually:
- Recovery takes roughly 9 years
That means:
- 9 years spent merely returning to the original level
- 9 years without net wealth growth
A 75% drawdown requiring a 300% recovery may take over 17 years at similar return rates.
This changes how drawdowns should be viewed.
A drawdown is not only:
- A capital loss
It is also:
- A compounding interruption
That interruption carries its own hidden cost.
Why “Long-Term Investing” Becomes Incomplete
A common statement in investing is:
“The market always recovers eventually.”
Technically, broad equity markets often do recover over sufficiently long periods.
But this framing leaves out something critical:
Recovery time itself has a compounding cost.
A portfolio that:
- Drops from $100 to $50
- Recovers to $100 after 8 years
Has not compounded during those 8 years.
Meanwhile:
- A portfolio that remained at $100 and compounded at 8%
Would be worth significantly more than $100 after the same period.
Price recovery and wealth recovery are not identical.
That distinction matters enormously.
The Sequence-of-Returns Problem
Loss timing changes outcomes dramatically.
Consider two portfolios:
Portfolio A
- Loses 40% early
- Then compounds positively for years
Portfolio B
- Compounds positively for years first
- Loses 40% later
Average returns may appear similar.
The long-term wealth outcomes are not.
Early losses damage the base from which all future compounding occurs.
This becomes especially destructive when:
- Withdrawals occur during retirement
- Additional contributions stop
- Recovery time is limited
Sequence risk is not a niche technicality.
For retirees and fixed-horizon investors, it is often the central risk.
How This Changes Position Sizing
Most investors think about position sizing like this:
“How much can I make if I’m right?”
Drawdown asymmetry reframes the question:
“How much compounding time disappears if I’m wrong?”
A position capable of:
- Doubling if successful
- Losing 60% if unsuccessful
Is not a neutral bet.
A 60% loss requires:
- 150% recovery
That may represent:
- Years of lost compounding
- Delayed financial goals
- Permanent wealth impairment
Position sizing therefore becomes:
- A recovery management problem
- Not merely a return-maximisation problem
Why Portfolio Drawdown Management Matters
Avoiding deep drawdowns has asymmetric value.
Avoiding:
- A 50% loss
Is mathematically equivalent to avoiding the need for:
- A 100% recovery gain
Those are not equivalent burdens.
This explains why portfolios with:
- Slightly lower returns
- But meaningfully smaller drawdowns
Can compound more effectively over long periods.
The benefit comes from preserving:
- Capital base
- Recovery time
- Compounding continuity
Where Standard Risk Metrics Become Incomplete
Volatility Treats Gains and Losses Symmetrically
Standard deviation measures upside and downside variation equally.
But:
- A 20% gain and a 20% loss are not equivalent events
A 20% loss requires:
- A 25% gain to recover
Volatility measures movement.
Drawdown asymmetry measures recovery cost.
Expected Value Misses Compounding Damage
Expected value calculations work well for:
- Single isolated bets
But investing involves:
- Repeated compounding across time
A strategy with positive expected value can still destroy long-term compounding if losses become large enough.
This is why:
- Geometric returns matter more than arithmetic averages
Compounding follows geometric mathematics.
Not average-return mathematics.
What Most Investors Misunderstand
“The Market Will Recover Eventually”
Recovery of price is not identical to recovery of wealth trajectory.
Years spent recovering carry opportunity costs.
Those lost years cannot be restored retroactively.
“Diversification Removes the Problem”
Diversification reduces:
- Probability of catastrophic loss
- Drawdown depth
But it does not eliminate drawdown asymmetry itself.
A diversified portfolio losing 30% still requires:
- 43% recovery
The asymmetry remains mathematically unchanged.
“Only Reckless Investors Need to Care About This”
False.
Major market drawdowns affect:
- Index funds
- Retirement portfolios
- Broad equity allocations
The asymmetry applies to all percentage-based portfolios.
Not only speculative trading.
When the Asymmetry Matters Most
Drawdown asymmetry becomes especially important when:
- Time horizons are limited
- Withdrawals are occurring
- Recovery periods cannot be extended indefinitely
- Additional contributions are impossible
The framework matters less when:
- Time horizons are extremely long
- No withdrawals occur
- Capital contributions continue steadily
Under sufficiently long timelines, even severe drawdowns can eventually recover.
But many investors do not operate under infinite timelines.
How This Changes Risk Management
Drawdown asymmetry changes the purpose of risk management.
The goal becomes:
- Preserving compounding continuity
Not merely:
- Avoiding emotional discomfort
This shifts emphasis toward:
- Position sizing discipline
- Leverage control
- Maximum drawdown management
- Capital preservation during extremes
Because mathematically:
Avoiding deep drawdowns is more valuable than recovering from them efficiently.
Frequently Asked Questions
Why does a 50% loss require a 100% gain?
Because gains after losses are calculated on a smaller base.
A portfolio falling from $100 to $50 must double from $50 to return to $100.
Does this apply to index funds?
Yes.
The mathematics apply to:
- Stocks
- Index funds
- ETFs
- Any percentage-based investment vehicle
Why do deep drawdowns damage compounding so severely?
Because:
- Recovery consumes years
- Compounding pauses during recovery
- Future gains operate from a smaller base
What is the difference between arithmetic and geometric returns?
Arithmetic returns measure average annual performance.
Geometric returns measure actual compounded wealth growth over time.
Volatility reduces geometric returns even when arithmetic averages remain unchanged.
Can diversification eliminate drawdown asymmetry?
No.
Diversification reduces drawdown probability and severity.
It does not change the mathematical relationship between losses and required recovery gains.
Why does sequence-of-returns risk matter?
Because early losses reduce the capital base available for future compounding.
This becomes especially dangerous during retirement withdrawals.
The Bottom Line
Drawdown asymmetry is not a behavioural theory.
It is a mathematical structure embedded directly into percentage-based compounding.
Understanding it changes how losses should be viewed.
The true cost of a deep drawdown is not:
- The percentage decline alone
It is:
- The decline
- The recovery gain required
- The years of compounding consumed during recovery
Most investors underestimate this because standard performance discussions focus on:
- Returns
- Average growth
- Recovery to previous highs
But the path matters.
And once losses become deep enough, the path itself becomes the dominant variable.
The asymmetry means:
Protecting capital before major losses occur is mathematically more powerful than trying to recover afterward.
That is not psychology.
It is arithmetic.